728x90
반응형
SMALL
1. 워드 클라우드(Word Cloud)
- 핵심 단어를 시각화하는 기법
- 문서의 키워드, 개념 등을 직관적으로 파악할 수 있게 핵심 단어를 시각적으로 돋보이게 하는 기법
1-1. wordcloud 라이브러리 설치 및 임포트
!pip install wordcloud
from wordcloud import WordCloud
📄 예제에 사용할 alice.txt
# alice.txt 파일 읽어오기
text = open('/content/drive/MyDrive/KDT/Python/2. 데이터분석/alice.txt').read()
text
1-2. generate()
- 단어별 출현 빈도수를 비율로 반환하는 객체를 생성
wordcloud = WordCloud().generate(text)
wordcloud  # 객체 주소값

>>>
<wordcloud.wordcloud.WordCloud at 0x7f16548619f0>
# words_ : 객체의 비율의 정보가 담긴 딕셔너리를 반환
wordcloud.words_
1-3. 시각화
import matplotlib.pyplot as plt

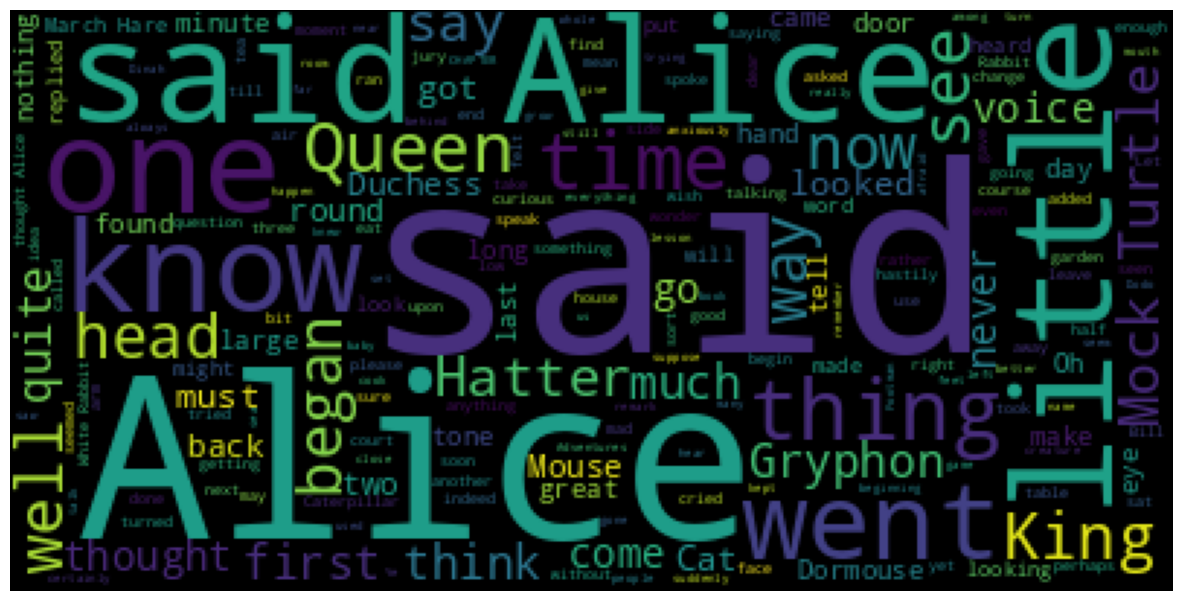
plt.figure(figsize=(15,10))
plt.imshow(wordcloud)   # wordcloud 객체를 넣으면 워드클라우드 형태의 그래프 생성
plt.axis('off')  #눈금 삭제
plt.show()
# max_words: 워드 클라우드에 표시되는 단어의 개수를 설정
wordcloud = WordCloud(max_words=100).generate(text)  # 단어 100개만 표시
plt.figure(figsize=(15,10))
plt.imshow(wordcloud)
plt.axis('off')
plt.show()
1-4. 불용어 설정
- 워드클라우드로 작성할 글에서 제외할 단어를 설정
from wordcloud import STOPWORDS

STOPWORDS  # 불용어로 등록된 단어들
type(STOPWORDS)

>>> set   # 중복값x
✅ 불용어 추가하기
# add(): 불용어 추가하기
STOPWORDS.add('said')
print(STOPWORDS)

>>> {"i'm", 'after', 'few', 'most', 'since', "you're", 'shall', "i'll", 'would', 'com', 'otherwise', "she'd", "won't", "we'll", 'yourself', 'himself', "why's", 'during', 'what', "that's", 'not', 'how', 'me', "hadn't", "i'd", "there's", 'same', 'else', "he's", 'such', 'ourselves', "they'll", 'more', "you've", 'i', 'was', 'could', "she's", 'its', 'http', 'while', 'herself', 'the', 'by', 'in', 'therefore', 'be', 'through', "i've", 'did', "hasn't", 'has', 'it', 'also', 'why', "they'd", 'my',...}
✅ 불용어를 제외하고 핵심 단어만 워드클라우드로 시각화하기
wordcloud = WordCloud(max_words=100,
                      font_path='/usr/share/fonts/truetype/nanum/NanumGothicExtraBold.ttf',
                      stopwords=STOPWORDS).generate(text) # 'said' 사라짐
plt.figure(figsize=(15,10))
plt.imshow(wordcloud)
plt.axis('off')
plt.show()
2. mask
- mask 이미지를 ndarray로 변환하여 워드클라우드를 시각화할 수 있음
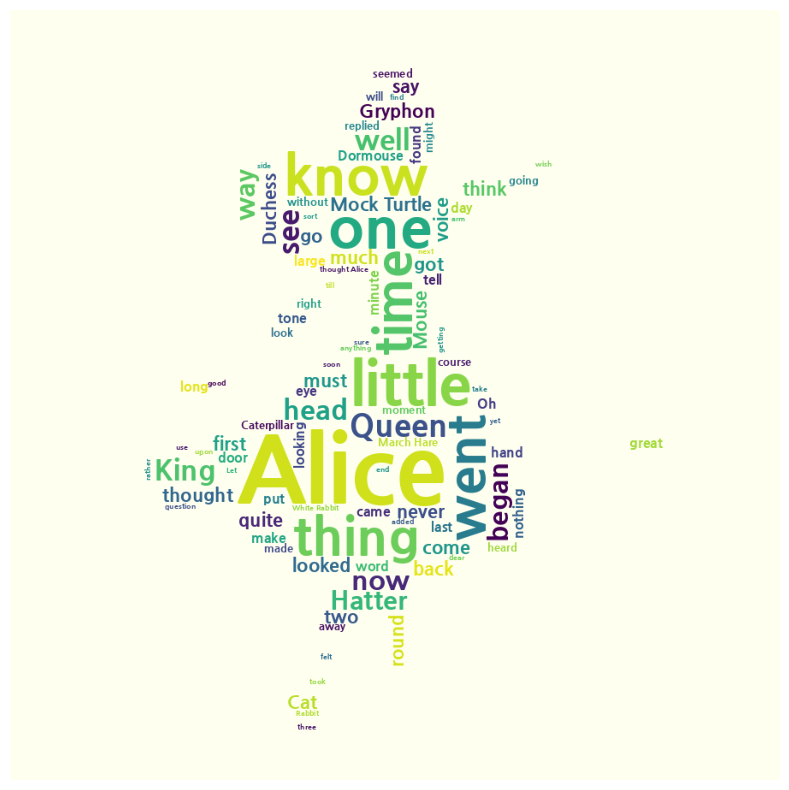
📄 alice.txt를 alice_mask.png에 나타내기
from PIL import Image
import numpy as np


# 이미지파일을 불러와 ndarray로 바꾼 데이터를 alice_mask에 담아줌
alice_mask = np.array(Image.open('/content/drive/MyDrive/KDT/Python/2. 데이터분석/alice_mask.png'))
alice_mask   # 255: 흰색인 픽셀, 0: 검은색 픽셀

wordcloud = WordCloud(max_words=100,
                      font_path='/usr/share/fonts/truetype/nanum/NanumGothicExtraBold.ttf',
                      stopwords=STOPWORDS,
                      mask=alice_mask,
                      background_color='ivory').generate(text) # 'said' 사라짐
plt.figure(figsize=(15,10))
plt.imshow(wordcloud)
plt.axis('off')
plt.show()

728x90
반응형
LIST
'Python > Data Analysis' 카테고리의 다른 글
| [파이썬, Python] folium 라이브러리 - 지도에 위치 표시하기! (0) | 2023.06.13 |
|---|---|
| [파이썬, Python] 형태소 분석 - KoNLPy (0) | 2023.06.13 |
| [파이썬, Python] Matplotlib - 시각화 라이브러리 (1) | 2023.06.13 |
| [파이썬, Python] Pandas 모듈 - 🔟 원 핫 인코딩(One Hot Encoding) (0) | 2023.06.13 |
| [파이썬, Python] Pandas 모듈 - 9️⃣ 데이터프레임에서 특정 데이터타입을 가진 열(column) 가져오기 select_dtypes (0) | 2023.06.13 |


